Configuring table metrics

About this task

Enable and configure the table histogram table options.

Procedure

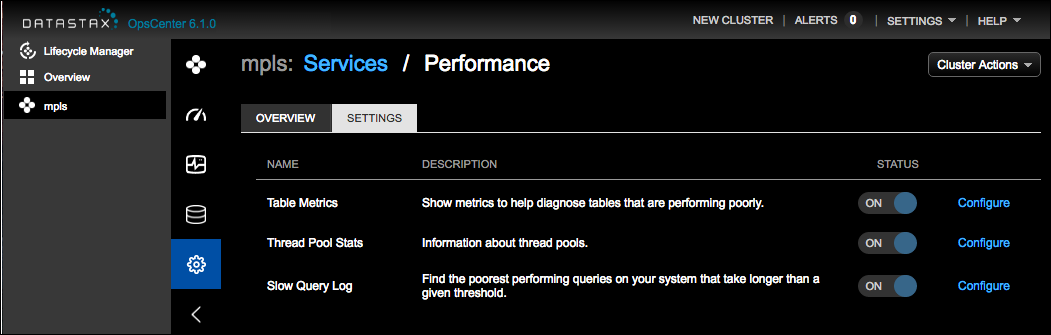
  1. Select cluster name > Services.

  2. Select Configure or Details for the Performance Service.

  3. Click the Settings tab.

    opscPerfServiceSettingsTab

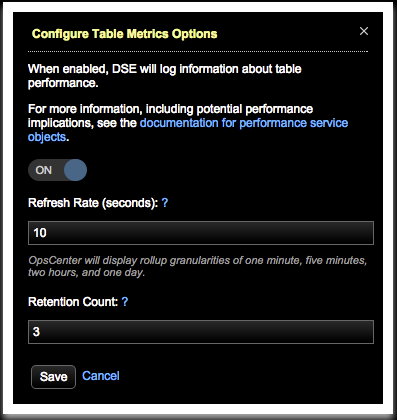
  4. Click the Configure link for Table Metrics.

    The Configure Table Metrics Options dialog appears.

    perfServiceConfigTableMetrics

  5. Enter a Refresh Rate in seconds that specifies how often DataStax Enterprise updates info in dse_perf tables. Setting the refresh rate to 60 seconds or greater is recommended to match the minimum default frequency at which OpsCenter collects and aggregates metrics data.

  6. Enter a Retention Count value that specifies the number of snapshots retained at any given time.

  7. Click Save.

Was this helpful?

Give Feedback

How can we improve the documentation?

© 2024 DataStax | Privacy policy | Terms of use

Apache, Apache Cassandra, Cassandra, Apache Tomcat, Tomcat, Apache Lucene, Apache Solr, Apache Hadoop, Hadoop, Apache Pulsar, Pulsar, Apache Spark, Spark, Apache TinkerPop, TinkerPop, Apache Kafka and Kafka are either registered trademarks or trademarks of the Apache Software Foundation or its subsidiaries in Canada, the United States and/or other countries. Kubernetes is the registered trademark of the Linux Foundation.

General Inquiries: +1 (650) 389-6000, info@datastax.com