View table metrics
View concentrated table metrics and charts thereof, along with alerts and recommendations for improving table performance. Table (column family) metrics are pre-populated in the lower half of the Table Metrics Performance page.
-
Select cluster name > Services.
-
Click the Configure link for the Performance Service.
The Overview tab shows the performance panels.
-
Click the title bar of the Table Metrics panel.
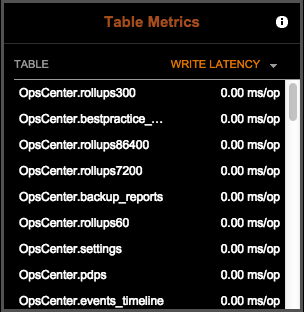
The Table Metrics performance page appears.
-
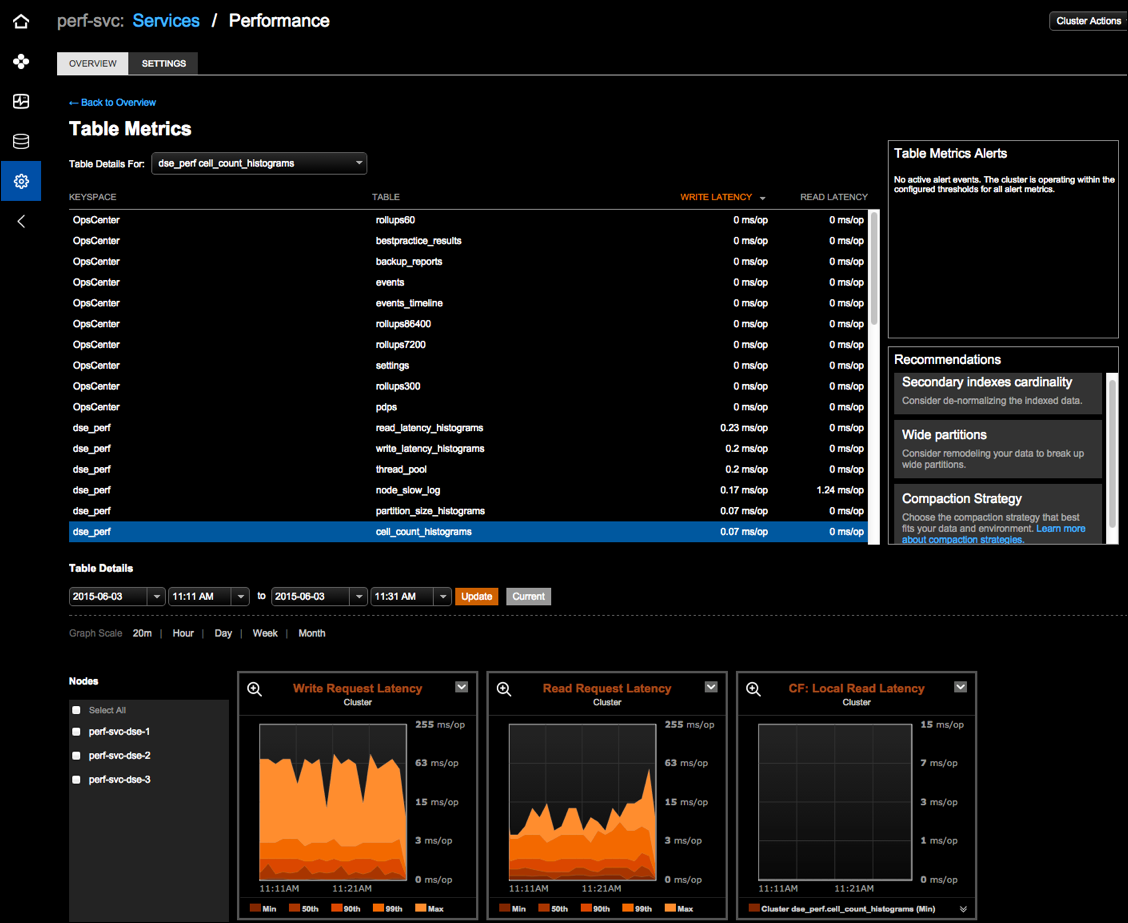
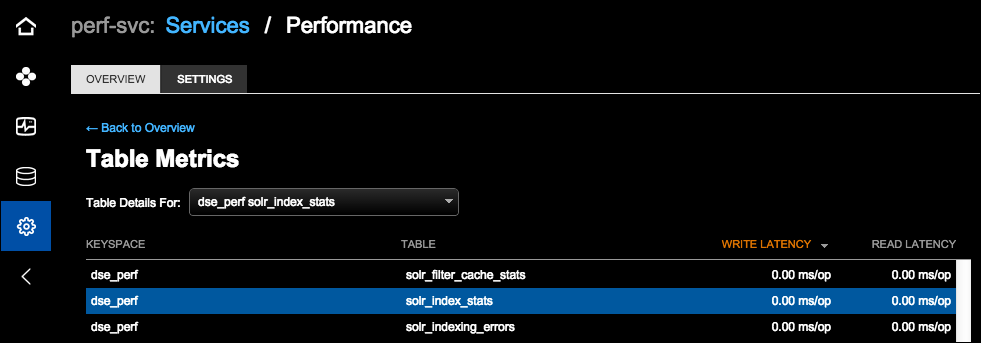
Select an option from the Table Details For list. The Table Metrics view updates and highlights the associated table row.
-
The Table Metrics performance details page provides multiple viewing options:
-
Date and time range: Select the date and time and click Update. Click Current to view real-time data.
-
Time Range: Select the granularity for the data in the metrics charts. Available options are by 20 minutes, Hour, Day, Week, or Month.
-
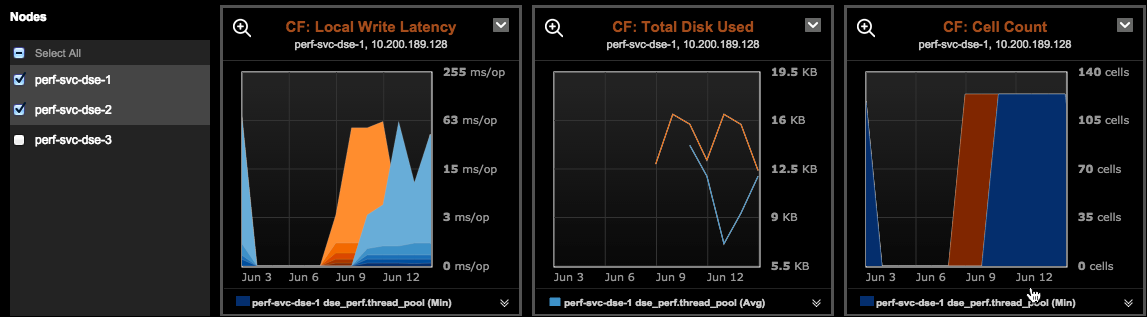
By default, all nodes are shown. Select a specific node from the Node list. Select a few nodes to view a visual side-by-side comparison.
-
