View thread pool statistics in the Performance Service
View details for thread pools statistics for a specific node or an entire cluster.
Thread pool statistics are generally intended for tracking node activity, rather than cluster activity.
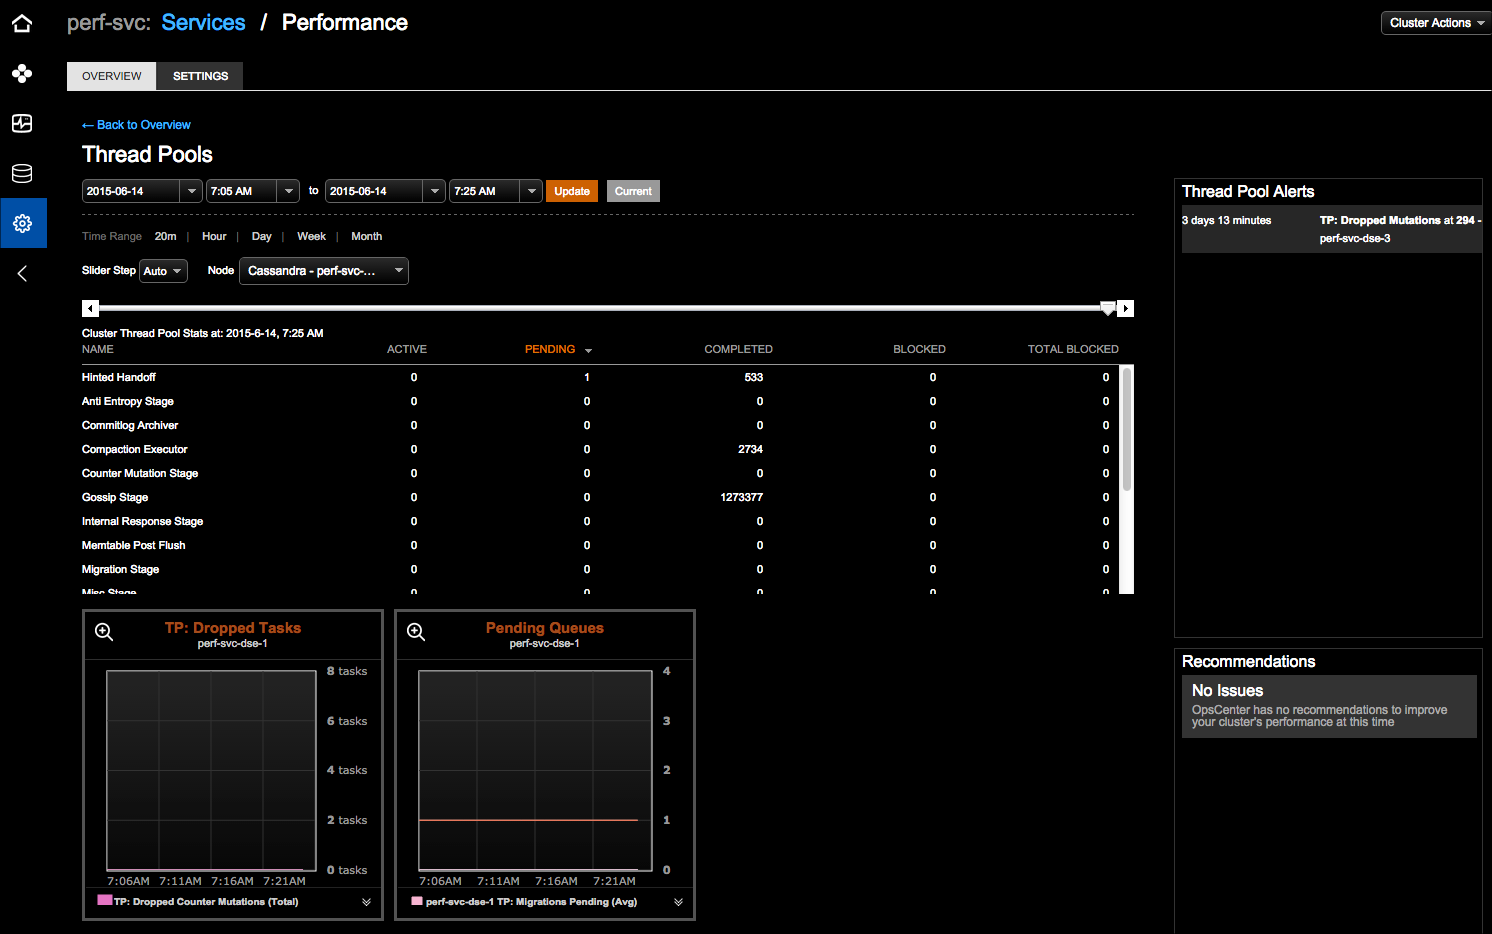
You can view thread pool alerts, recommendations for improving cluster performance, and filter the thread pool statistics by date and time range.
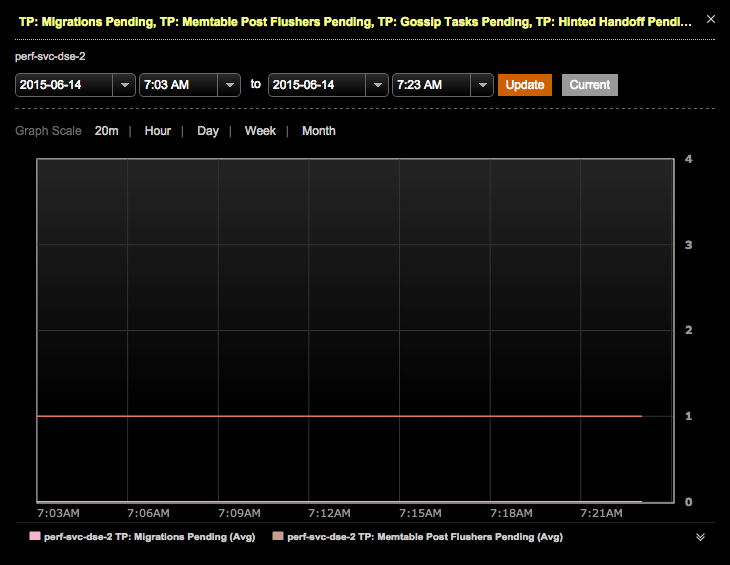
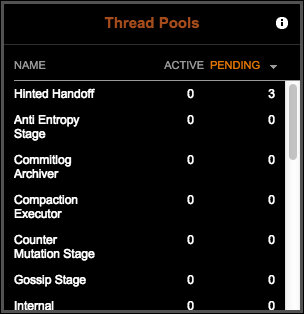
For each statistic, you can view the name, active tasks, pending tasks, completed tasks, blocked tasks, and total blocked tasks. The Pending column is sortable in both the overview mini-panel and the main Thread Pools page. The Thread Pool Dropped Tasks and Pending Queues graphs provide a visualization of the metrics.
Thread Pool Stats can also be viewed in the Node Details dialog available from the Node or List view of the Nodes area.
-
Select cluster name > Services.
-
Click the Configure link for the Performance Service.
The Overview tab shows the performance panels.
-
Click the title bar of the Thread Pools panel.
The Thread Pools performance details page appears.
-
The Thread Pools page provides multiple options for viewing thread pool data:
-
Date and time range for data: Select the date and time and click Update. Click Current to view real-time data.
-
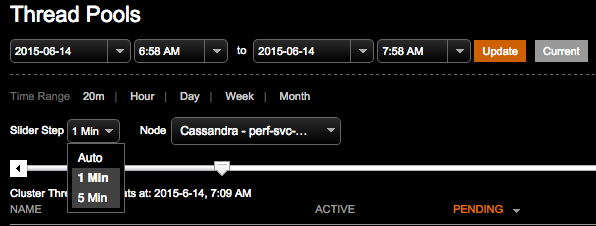
Time Range: Select the granularity for the data in the thread pools statistics table. Available options are by 20 minutes, Hour, Day, Week, or Month. The selected granularity affects the view and the options available in the Slider Step list.
-
Select the increment by which to move the slider bar for viewing the range of data over time from the Slider Step list. Click the bar or drag to dynamically change the view of the statistics activities.
-
Select either a cluster-wide view or a specific node from the Node list.
-
-
Click the magnifier option in the metrics panels to view expanded details. Change the date and time range or the Graph Scale granularity.