View slow queries
View any slow queries along with alerts and recommendations for improving query performance.
The ability to trace queries requires permission granted in your user role.
-
Select cluster name > Services.
-
Click the Configure link for the Performance Service.
The Overview tab shows the performance panels.
-
Click the title bar of the Slow Queries panel.
The Slow Queries performance details page appears.
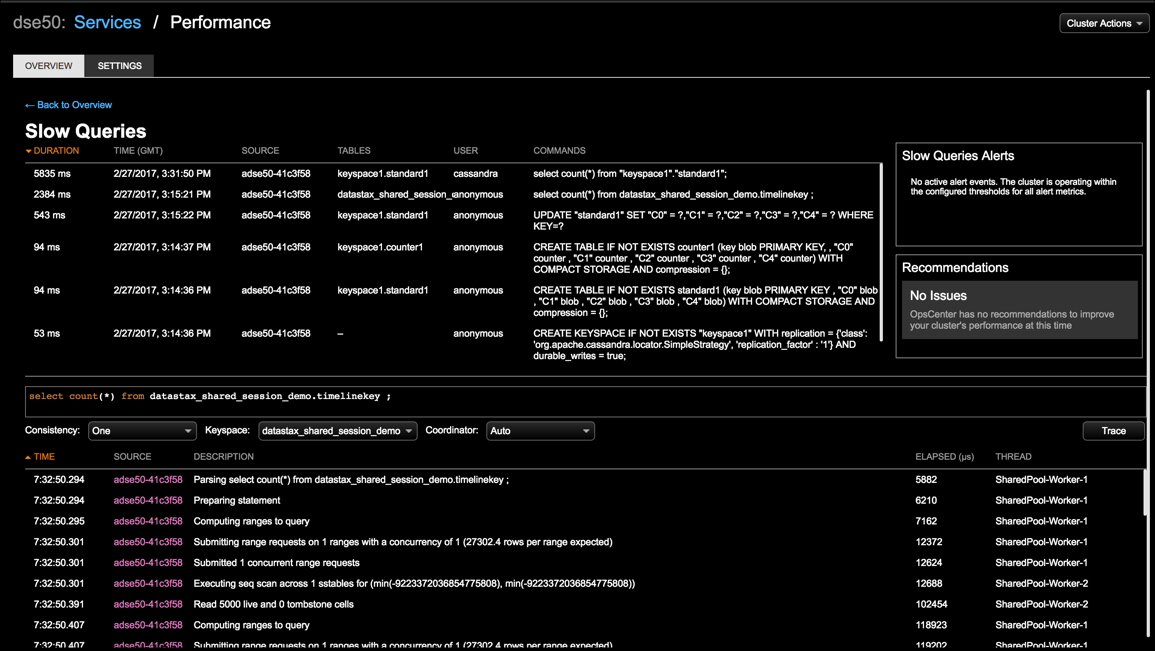
Any Cassandra tables with queries that take longer than the configured threshold appear in the Slow Queries list. System and OpsCenter keyspaces are excluded from the Slow Queries list.
The User column shows the users who are running slow queries.
Slow queries are only shown for data since the last time the agent was restarted. For more information, see the known issue.
-
Sort the slow queries by any column header.
