Monitor DSE Search clusters
You can monitor DSE Search metrics using JMX and MBeans.
DSE Search MBeans are identified by the following paths, where SEARCH_INDEX is the name of a specific search index:
type=search,index=SEARCH_INDEX,name=CommitMetrics
type=search,index=SEARCH_INDEX,name=MergeMetrics
type=search,index=SEARCH_INDEX,name=QueryMetrics
type=search,index=SEARCH_INDEX,name=UpdateMetrics
type=search,index=SEARCH_INDEX,name=IndexPool
type=search,index=SEARCH_INDEX,name=StallMetrics
StallMetrics is exposed through the metrics registry com.datastax.bdp.metrics.
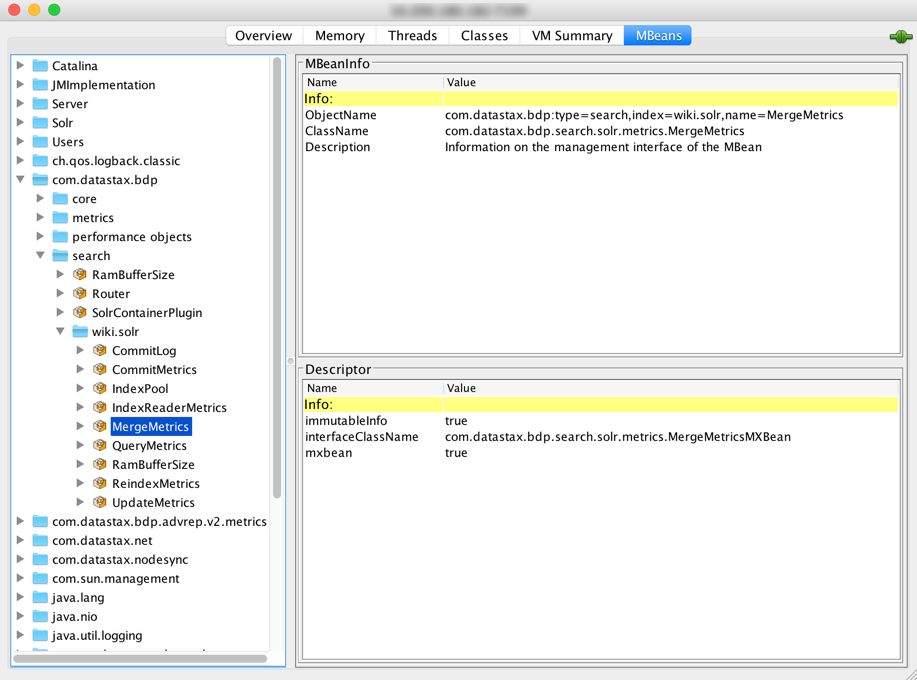
com.datastax.bdp/MergeMetrics MBean in JConsole with a search index named demo.solrCommitMetrics MBean
Use the commit metrics MBean to do the following:
-
Troubleshoot index performance.
-
Troubleshoot data consistency issues caused by asynchronous commits between different index replicas.
-
Tune indexing back pressure.
The commit metrics MBean records the amount of time required to execute the following two main phases of a commit operation on an index. Latency is measured in microseconds.
- FLUSH
-
The time spent flushing the async indexing queue.
- EXECUTE
-
The time spent actually executing the commit on the index.
The following commit metrics MBean set and get operations are available:
- setEnabled(Boolean enabled)
-
Enables/disables metrics recording. The default is enabled.
- resetLatency(String phase)
-
Resets latency metrics for a specified phase (
FLUSHorEXECUTE). - resetLatencies()
-
Resets all latency metrics.
- isEnabled()
-
Whether metrics recording is enabled.
- getLatencyPercentile(String phase, double percentile)
-
Gets a commit latency percentile for a specified phase (
FLUSHorEXECUTE). - getRecordedLatencyCount(String phase)
-
Gets the total count of recorded latency metrics for a specified phase (
FLUSHorEXECUTE). - getUnrecordedLatencyCount()
-
Gets the total count of unrecorded latency values due to exceeding the maximum tracked latency, which is 10 minutes.
EndpointStateTracker MBean
The EndpointStateTracker MBean observes the state of other nodes using the gossiper.
You can use this MBean to disallow (Blacklisted) a node from participating in distributed search queries and other operations that include node health, workload, and status.
The EndpointStateTracker MBean is identified by the following path:
com.datastax.bdp:name=EndpointStateTracker,type=core,name=EndpointStateTrackerThe following attributes are available:
- Blacklisted
-
Boolean attribute to remove a node from the list of searchable nodes while it’s being diagnosed, repaired, reindexed, and verified as healthy.
Sets blacklisted status that is gossiped around the cluster and used during the replica selection phase of distributed search queries:
-
true: Forcibly rank this node below active nodes for distributed search queries. -
false: Make this node eligible for selection during distributed search queries.
-
- ServerID
-
String that identifies the server ID of a local node.
The following operations are available. Arguments for all operations are strings representing node IP address, unless otherwise noted.
- getNodeHealth
-
Gets the node health for a given IP address.
- getWorkloads
-
Gets the workload type of a remote endpoint. Persists between restarts.
- getDatacenter
-
Gets the datacenter for the given endpoint, based on the information from the gossiper or information saved in the
cassandrasystem table. Persists between restarts. - getActiveStatus
-
Gets active status for the given endpoint. A node is active when the server and required plugins are all started. Computed at runtime.
- getServerId
-
Gets the DSE multi-instance server ID for a remote endpoint. Persists between restarts.
- getCoreIndexingStatus
-
Gets the dynamic indexing status (
INDEXING,FINISHED, orFAILED) of the search index of a given endpoint. Computed at runtime. - getRing
-
Takes a single argument: the keyspace. Returns information about every node in the cluster. Computed at runtime.
- getIsGraphServer
-
Returns true if Graph is enabled for the given endpoint. Computed at runtime.
- vnodesEnabled
-
Returns true if vnodes are enabled. Computed at runtime.
- getBlacklistedStatus
-
Whether a node isn’t on the list of searchable nodes. Persists between restarts.
The gossip state is persisted locally. Set the
Blacklistedattribute to remove a node’s blacklisted status.You can also use the
nodetool sjkcommand to blacklist a node.
IndexPool MBean
The IndexPool MBean exposes metrics around the progress of indexing tasks as they move through the pipeline.
It also provides a mechanism to tweak the flushing, concurrency, and back-pressure behavior of a core indexing thread pool.
- Properties
-
You can use the
IndexPoolMBean to control task submission and flush with the following properties:-
Configurable concurrency: The maximum number of concurrent workers is predefined at construction time. The actual concurrency can be dynamically configured between
1(synchronous execution) and the given max concurrency. -
Flow control via back pressure: To reduce memory consumption in case of fast producers, back pressure throttles incoming tasks. Back-pressure is applied directly as a result of the size of the global RAM buffer.
-
- Path
-
The IndexPool MBean is identified by the following path:
com.datastax.bdp.search.KEYSPACE_NAME.TABLE_NAME.IndexPool-
search: The MBean type -
KEYSPACE_NAME.TABLE_NAME: The search index (core) that the metrics reference -
IndexPool: The MBean name
-
- Configurable attributes
-
The following
IndexPoolMBean attributes are configurable. However, these changes only apply until the node is restarted. To persist these changes, you must change the corresponding option indse.yaml.-
FlushMaxTime: The maximum time, in milliseconds, to wait before flushing asynchronous index updates, which occurs at DSE Search commit time or at database flush time. For permanent configuration, set theflush_max_time_per_coreoption indse.yaml. -
Concurrency: The maximum number of concurrent asynchronous indexing threads.
-
- Read-only attributes
-
The following read-only MBean operations are available:
-
BackPressurePauseNanos: Get the average back pressure pause. -
IncomingRate: Get the 1-minute rate of ingested tasks per second. -
MaxConcurrency: Get the predefined max concurrency level. -
OutgoingRate: Get the 1-minute rate of processed tasks per second. -
ProcessedTasks: Get the total number of processed tasks for all workers. -
QueueSize: Get the current size of each processing queue. -
TaskProcessingTimeNanos: Get the last processing time for all workers. Can be0if clock resolution is too coarse. -
Throughput: Get the 1-minute rate of work throughput per second. -
TotalQueueSize: Get the total size of all processing queues.
-
Merge metrics MBean
The merge metrics MBean tracks the time that Apache Solr and Apache Lucene™ spend on merging segments that accumulate on disk. Segments are files that store new documents, and they are a self-contained index. After segments are written to disk, they are immutable.
When data is deleted, Lucene doesn’t remove it; instead, it marks documents as deleted. During the merging process, Lucene copies the data from separate segment files into one new file. Documents that are marked deleted aren’t included in the new segment file. Then, Lucene removes the previous segment files, and the new file holds the index on disk.
In a high throughput environment, having only one segment file is rare. Typically, there are several files, and Lucene runs the merge metric operation concurrently with inserts and updates of data using a merge policy and merge schedule.
Merge operations are costly and can impact the performance of CQL queries. A huge merge operation can cause a sudden increase in query execution time. You can use the merge metrics MBean to monitor and tune merge operations.
The main phases of a merge operation on the index are as follows:
- INIT
-
The elapsed time to initialize the merge process.
- WARM
-
The elapsed time to warm up segments to speed up cold queries.
- EXECUTE
-
The elapsed time to execute the merge process. Includes
WARMtime:EXECUTE time = WARM time + other operationsFor example, if the
EXECUTEphase is 340 ms, and theWARMphase is 120 ms, then other operations account for the remainingEXECUTEtime (220 ms).
To get merge metrics, insert one of the merge metrics MBean operations and select a phase (INIT, WARM, or EXECUTE).
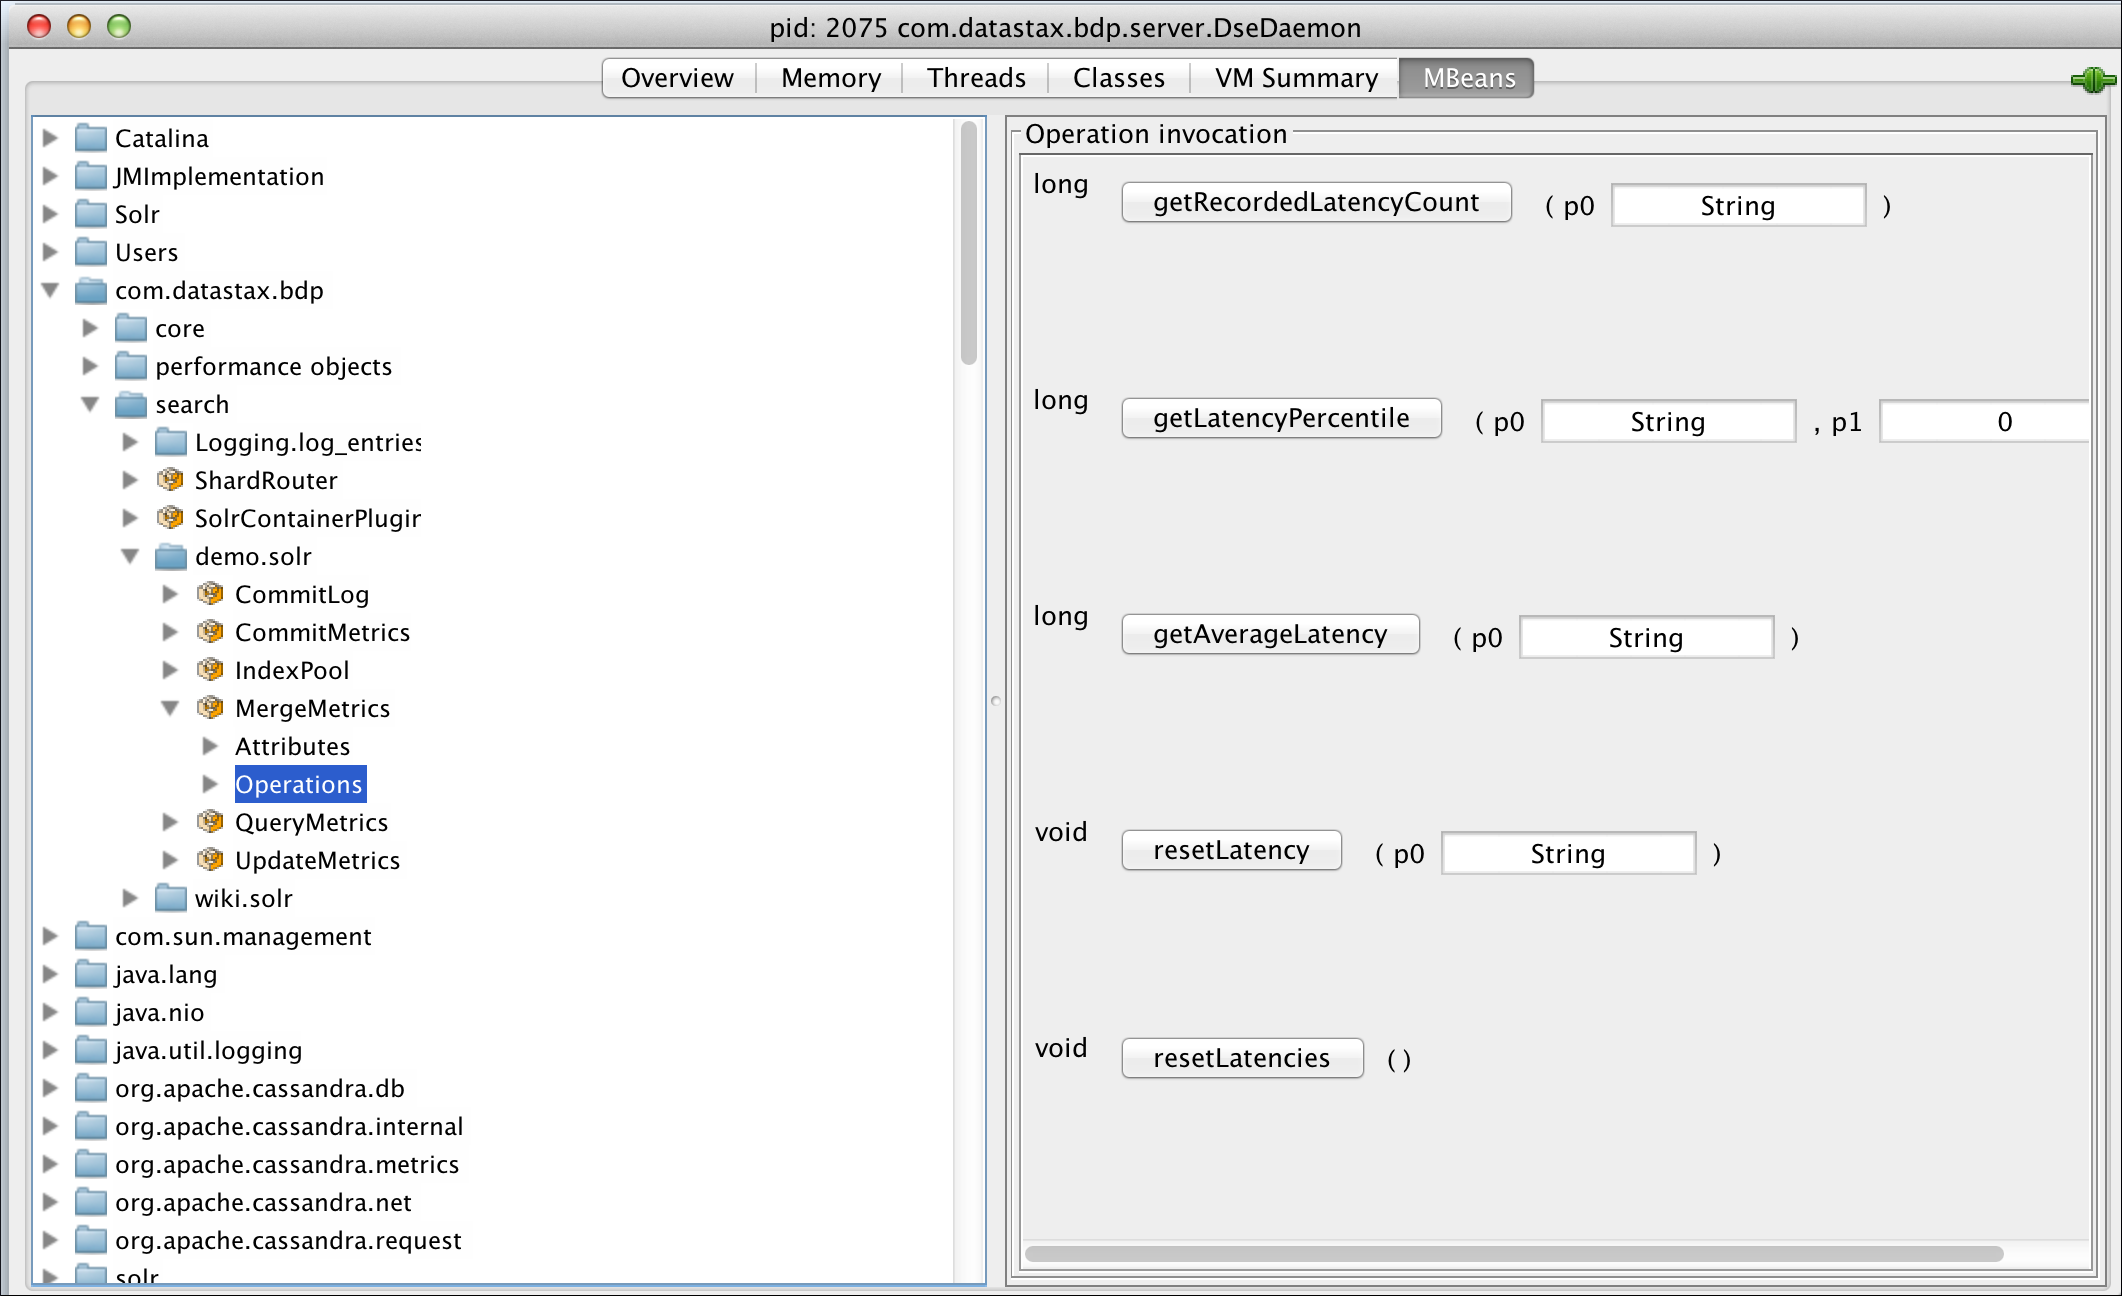
The following merge metrics MBean operations are available:
-
getRecordedLatencyCount -
getLatencyPercentile -
getAverageLatency -
resetLatency -
resetLatencies
QueryMetrics MBean
Use the query metrics MBean to:
-
Troubleshoot query performance.
-
Tune DSE Search configuration, such as the search index schema and caches.
-
Tune server resources, such as the JVM heap.
-
Record the amount of time spent to run the main operational phases of a distributed query on the search index.
-
Measure latency in microseconds.
To group by query, provide an additional QUERY.NAME parameter.
For example, for a search index named demo.solr with an indexed field named type, use the following URL to provide the additional QUERY.NAME parameter:
http://localhost:8983/solr/demo.solr/select/?q=type:1&query.name=myqueryAll metrics collected under a given query name are recorded and retrieved separately. If a query name is not provided, all metrics are recorded together.
Main operational phases
The main phases of a distributed query operation are as follows:
- ENQUEUE
-
The time that a query request waits for a thread to execute.
- EXECUTE
-
The time that a single shard takes to execute the actual index query. This value is computed on the local node executing the shard query.
- RETRIEVE
-
The time that a node takes to retrieve a single row from the database. This value will be computed on the local node hosting the requested data.
- COORDINATE
-
The total amount of time spent by the coordinator node to distribute the query and gather/process results from shards. This value is computed only on query coordinator nodes. Includes
RETRIEVEandEXECUTEin the total. - TOTAL
-
The total server-side time for a search query. The sum of all other phases, specifically
ENQUEUEandCOORDINATE, which includesRETRIEVEandEXECUTE.
QueryMetrics MBean set operations
The following operations are available:
- setEnabled(boolean enabled)
-
Enables/disables metrics recording. The default is enabled.
- isEnabled()
-
Whether metrics recording is enabled.
- getLatencyPercentile(String phase, String query, double percentile)
-
Gets a query latency percentile by its query name, which is optional and can be null, and phase.
- getRecordedLatencyCount(String phase, String query)
-
Gets the total count of recorded latency metrics by its query name, which is optional and can be null, and phase.
- getUnrecordedLatencyCount()
-
Gets the total count of unrecorded latency values due to exceeding the maximum tracked latency, which is 10 minutes.
- resetLatency(String query)
-
Resets latency metrics for the given query name, which is optional and can be null.
- resetLatencies()
-
Resets all latency metrics.
QueryMetrics MBean attributes
The following attributes are available:
- Enabled
-
Whether metrics recording is enabled.
- EnqueuedRequestCount
-
Indicates the number of client requests that are currently waiting for a query thread.
If the value of
EnqueuedRequestCountincreases or stagnates above zero for a prolonged period, then DSE Search has reached a point of maximum throughput. At this point, additional load only increases latency.To access this attribute, use the
-foption to select it with thenodetool sjkcommand:nodetool sjk -p 7199 mx -mg \ -b com.datastax.bdp:type=search,index=demo.solr,name=QueryMetrics \ -f EnqueuedRequestCount - UnrecordedLatencyCount
-
The total count of unrecorded latency values due to exceeding the maximum tracked latency, which is 10 minutes.
ReindexMetrics MBean
Reindex metrics describe the current state and history of reindexing tasks.
Requesting a core reindex with dsetool reload_core doesn’t create a queue of reindexing tasks on a node.
Instead, a reindexing task is started that handles all reindex requests already submitted to that node.
The reindex metrics MBean is registered for each core with metricType=ReindexMetrics.
It is identified by the following path:
com.datastax.bdp.search.KEYSPACE_NAME.TABLE_NAME.ReindexMetrics-
search: The MBean type -
KEYSPACE_NAME.TABLE_NAME: The search index (core) that the metrics reference. -
ReindexMetrics: The MBean name
The following operations are available:
| Metric name | Allowed values | Description |
|---|---|---|
Progress Percentage |
Integer, 0 to 100 |
Reindexing progress. 100 indicates that reindexing is complete and not running. |
Reindexing |
Boolean |
Indicates if a search core is being reindexed. |
Current reindexing reason |
|
Reason for current reindexing. |
Reindexing Pending |
Boolean |
Indicates if a user-requested reindex is awaiting execution. |
Reindex ETA |
Long |
ETA in milliseconds. |
Total Requests Submitted |
Integer |
Number of reindex requests of all types submitted since node startup. |
Total User Requests Submitted |
Integer |
Number of reindex requests submitted by user since node startup. |
Total Reindexings Run |
Integer |
Total number of reindexing tasks executed since startup. |
Reindexings Run Due To User Request |
Integer |
Total number of reindexing tasks executed on behalf of a user since startup. |
Reindexings Run With Index Delete |
Integer |
Number of reindexing tasks executed with |
Reindexing Time |
Long |
Timer for reindexing.
Uses |
ShardRouter MBean
The ShardRouter MBean provides information about how DSE Search routes queries. It isn’t present in open source Apache Solr.
Use the com.datastax.bdp:type=ShardRouter MBean to retrieve information and update the list of endpoints for a DSE Search cluster.
The following attributes and operations are available:
-
getShardSelectionStrategy(String core): Retrieves the name of the shard selection strategy used for the given search core. -
getEndpoints(String core): Retrieves the list of endpoints that can be queried for the given search core. -
getEndpointLoad(String core): Retrieves the list of endpoints with related query load for the given search core. The load is computed as 1-minute, 5-minute, and 15-minute exponentially weighted moving averages, based on the number of queries received by the given node. -
refreshEndpoints(): Manually refreshes the list of endpoints to be used for querying Solr cores.
Solr MBeans
The solr/NativeAllocatorStats MBean exposes native memory allocation.
DataStax Enterprise (DSE) provides enhanced visibility into native memory allocation through the solr/NativeAllocatorStats MBean, exposing the following information:
-
enabled: Whether native memory is enabled. -
debug: Whether debug mode is enabled. -
numAlloc: The number of native objects allocations. -
numFree: The number of freed native objects. -
activeAllocatedMemoryInBytes: The allocated native memory currently in use. -
totalAllocatedMemoryInBytes: The total allocated native memory over time. -
totalFreedMemoryInBytes: The total freed native memory over time.
The solr/NativeTrackerStats MBean provides information about the tracked native objects and related threads that allocated them:
-
registeredThreads: The number of threads currently registered and actively tracking (allocating) native objects. -
trackedObjects: The number of currently tracked (allocated and not freed) native objects. -
handedOffObjects: The number of currently handed off (allocated and stored for later reuse) native objects.
UpdateMetrics MBean
Use the update metrics MBean to tune all factors that impact indexing performance, such as back pressure, indexing threads, RAM buffer size, and merge factor.
The update metrics MBean records the amount of time spent to execute an index update, split by the following main phases:
- QUEUE
-
Updated for reindexing only. The time spent by the index update task into the index pool.
- PREPARE
-
The time spent preparing the actual index update.
- EXECUTE
-
The time spent to actually execute the index update on Apache Lucene™.
|
The maximum tracked latency is 10 minutes. Latency values are reported in microseconds. |
The following MBean operations are provided:
- setEnabled(Boolean enabled)
-
Enables/disables metrics recording. The default is enabled.
- isEnabled()
-
Checks if metrics recording is enabled.
- getLatencyPercentile(String phase, double percentile)
-
Gets a commit latency percentile by its phase.
- getRecordedLatencyCount(String phase)
-
Gets the total count of recorded latency metrics by its phase.
- getUnrecordedLatencyCount()
-
Gets the total count of unrecorded latency values, because exceeding the max tracked latency.
- resetLatency(String phase)
-
Resets latency metrics for the given phase.
- resetLatencies()
-
Resets all latency metrics.
Use the solr_stress demo to test DSE Search performance
The solr_stress demo is a benchmark tool that simulates the number of requests for reading and writing data on a DSE Search cluster using a specified sequential or random set of iterations.
The following steps use the solr_stress demo to evaluate the performance of a DSE Search node.
First, use JConsole to view JMX metrics and operations exposed by DSE.
Then, run the solr_stress demo and evaluate the results.
-
Start a single DSE Search node, if you don’t already have one running.
-
Find the process ID (PID) of the DSE Search node:
pgrep -f dseResult368 668 45706 -
Verify the PID of the DSE Search node:
pgrep -f cassandra 45706In this example,
45706is the correct PID for DSE andcassandra. -
Start JConsole using the PID of the DSE Search node:
jconsole 45706For more information, see Monitor DataStax Enterprise (DSE) clusters.
-
In JConsole, create a connection to the DSE Search node.
For example, connect to the Local Process
com.datastax.bdp.DseModule.For visibility into native memory allocation through the
solr/NativeAllocatorStatsMBean, see Solr MBeans. -
Change to the
demos/solr_stressdirectory in your DSE installation so thatsolr_stressis your current working directory.The default location of the
demosdirectory depends on the type of installation:-
Package installations:
/usr/share/dse/demos -
Tarball installations:
INSTALL_DIRECTORY/demos
-
-
From within the
solr_stressdirectory, create the schema:pushd resources/schema && ./create-schema.shThe following options are available:
-
--ssl: Use SSL for CQL table creation withcqlsh. -
-e CA_CERT_FILE: Use the provided CA certificate for secure Solr HTTP requests. -
-E CLIENT_CERT_FILE: Use the provided client certificate for secure Solr HTTP requests. -
-h HOST: Hostname or IP for Solr HTTP requests. -
-a: Enable Kerberos authentication for Solr HTTP requests. -
-u USERNAME: Use the provided Kerberos username for Solr HTTP requests. -
-p PASSWORD: Use the provided Kerberos password for Solr HTTP requests.
The script creates the schema and posts the
solrconfig.xmlandschema.xmlfiles tohttp://localhost:8983/solr/resource/demo.solr/solrconfig.xmlandhttp://localhost:8983/solr/resource/demo.solr/schema.xml. Then, the script creates the search index by posting tohttp://localhost:8983/solr/admin/cores?action=CREATE&name=demo.solr.You can override the script defaults with the following command line parameters:
-x schemafile.xml \ -t tableCreationFile.cql \ -r solrConfigFile.xml \ -k solrCore -
-
Run the benchmark demo
run-benchmark.sh.By default, the script creates a Search index named
demo.solrand indexes 50,000 documents../run-benchmark.sh \ --clients=CLIENTS_COUNT \ --loops=LOOPS_COUNT \ --fetch=FETCH_SIZE \ --solrCore=SOLR_CORE \ --testData=TEST_DATA_FILE \ --url=URL1,URL2,URL3,... \ --qps=QPS \ --stats=BOOLEAN \ --seed=SEED_VALUEThe following options are available:
-
--clients: The number of client threads to create.Default:
1 -
--loops: The number of times the commands list is executed if running sequentially, or the number of commands to run if running randomly.Default:
1 -
--fetch: Fetch size for CQL pagination. Only the first page is retrieved.Default: Disabled
-
--solrCore: Search index name to run the benchmark against, such asdemo.solr. -
--testData: Name of the file that contains the test data. -
--url: A comma delimited list of servers to run the benchmark against.Example:
--url=http://localhost:8983,http://192.168.10.45:8983,http://192.168.10.46:8983Default:
http://localhost:8983 -
--qps: Maximum number of queries per second allowed. -
--stats: Specifies whether to gather statics during runtime and create a csv file with the recorded values.Default:
false -
--seed: Value to set the random generator seed to.
You can omit an option to use its default value or leave it unset, if allowed. For example:
./run-benchmark.sh --url=http://localhost:8983 --testData=resources/testCqlQuery.txt --solrCore=demo.solr./run-benchmark.sh --url=http://localhost:8983 --testData=resources/testCqlWrite.txt --solrCore=demo.solrFor more information and command examples, see
/demos/solr_stress/README.txt. -
-
In JConsole, go to the MBeans tab.
-
In the directory tree, navigate to
com.datastax.bdp/search/demo.solr.If the demo ran successfully,
CommitMetricsandQueryMetricsMBeans are present. -
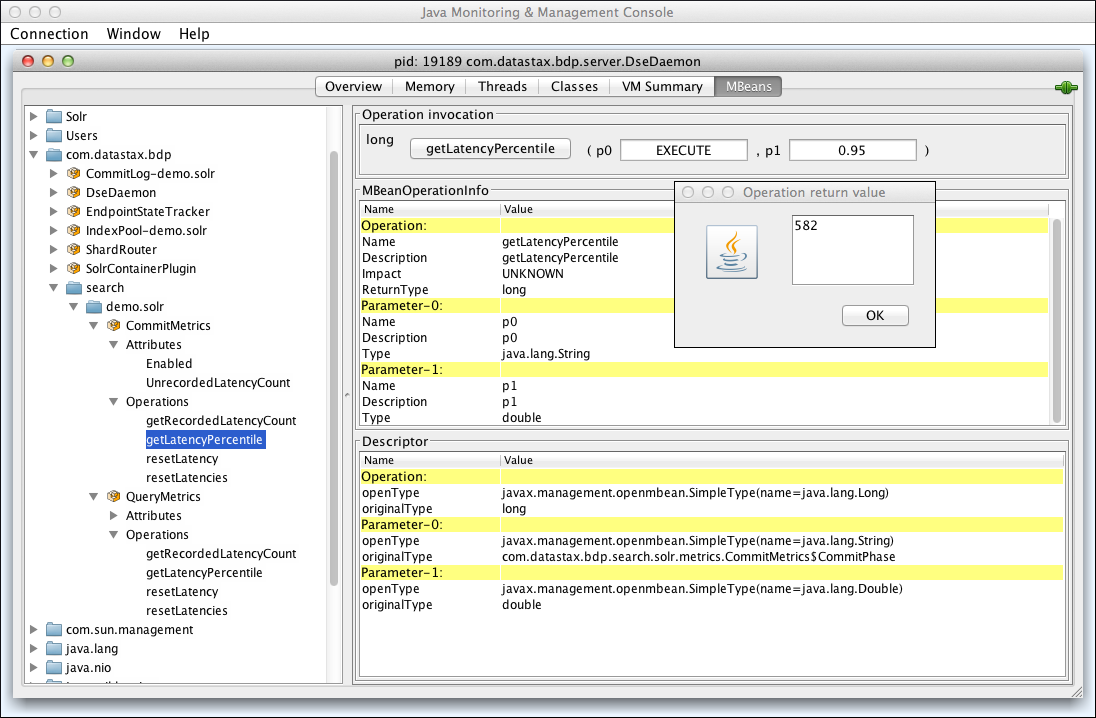
In the directory tree, expand the
CommitMetricsMBean, expandOperations, and then selectgetLatencyPercentile. -
In the p0 field, enter
EXECUTE. -
In the p1 field, enter
0.95. -
Click getLatencyPercentile.
The operation runs and returns the latency percentile value in a new window. In the following example, the returned value was 582 microseconds: