Monitor DataStax Enterprise (DSE) clusters
DataStax Enterprise (DSE) provides many metrics about your clusters that help you understand a cluster’s performance characteristics. This information is critical to diagnosing issues and planning capacity.
DSE exposes statistics and management operations through Java Management Extensions (JMX). JMX is a Java technology that supplies tools for managing and monitoring Java applications and services. You can use JMX to monitor or manipulate any statistic or operation that is exposed as an MBean by a Java application.
During normal operation, the database outputs information and statistics that you can monitor using JMX-compliant tools, such as the following:
You can also use these tools for certain administrative operations, such as flushing caches or repairing nodes.
For more robust oversight and visualization, you can integrate DSE statistics into dashboards and alerting tools, including DataStax tools and third-party monitoring services.
JMX authentication
Configure JMX authentication if you want to access remote nodes with JMX, authenticate JMX users, or implement role-based access control to MBeans. For more information, see the following:
Get MBeans with jmxterm
You need the complete names of MBeans to make calls to MBeans from the command line or set MBean permissions in CQL.
The following example shows how to use jmxterm to get the full list of JMX MBeans from a local database node.
To connect to a remote node, JMX must be exposed externally on the node.
echo "beans" | java -jar jmxterm-1.0.0-uber.jar -l localhost:7199 -n 2>&1|
Only perform this operation in isolation because the list can be large. Alternatively, you can filter the results of the initial |
Use the resulting MBean strings exactly as printed to fetch and manage metrics.
This includes MBean names in the nodetool sjk mx command, metrics searches in JConsole, and MBean permission management with the CQL GRANT and REVOKE commands.
com.datastax.bdp.advrep.v2.metrics:name=CommitLogMessagesRead,type=ReplicationLog
          com.datastax.bdp.advrep.v2.metrics:name=CommitLogsDeleted,type=ReplicationLog
          com.datastax.bdp.advrep.v2.metrics:name=CommitLogsToConsume,type=ReplicationLog
          org.apache.cassandra.db:type=Commitlog
          org.apache.cassandra.metrics:name=CompletedTasks,type=CommitLog
          org.apache.cassandra.metrics:name=PendingTasks,type=CommitLog
          org.apache.cassandra.metrics:name=TotalCommitLogSize,type=CommitLog
          org.apache.cassandra.metrics:name=WaitingOnCommit,type=CommitLog
          org.apache.cassandra.metrics:name=WaitingOnSegmentAllocation,type=CommitLog
Once you know the MBean strings, you can use jmxterm and other tools described in this guide to do the following:
-
Get MBean attribute values.
-
Set attribute values, if they are settable.
-
Call MBean functions, which can be used to temporarily modify DSE behavior similar to
nodetoolcommands.
For example, the following jmxterm command retrieves the Value of the specified MBean attribute.
To get a full list of supported commands, run help inside the interactive jmxterm console.
get -b org.apache.cassandra.metrics:type=Cache,scope=KeyCache,name=Size ValueUse Java Console (JConsole)
JConsole is a JMX-compliant tool for monitoring Java applications. JConsole consumes the JMX metrics and operations exposed by DSE and prints them to a well-organized GUI.
|
If you choose to monitor DSE using JConsole, understand that JConsole consumes a significant amount of system resources. For this reason, DataStax recommends running JConsole on a remote machine rather than on the same host as the DSE node. |
-
Open a terminal, and then start
jconsoleto open the JConsole GUI:jconsoleJConsole is included with Java distributions like OpenJDK. If the JDK isn’t installed on the machine where you are running JConsole, see the JDK installation guides in the Oracle and OpenJDK documentation.
To use JConsole with SSL, see Setting up SSL for jconsole (JMX).
-
In the JConsole GUI, create a connection to your DSE node:
-
Select Remote Process.
-
Enter the node’s IP address and port number.
The default DSE JMX metrics monitoring port is 7199.
-
If you enabled JMX authentication, enter a username and password to authenticate to the node.
-
Click Connect.
-
-
After the connection is established, click the MBeans tab.
For each connected node, JConsole provides information and controls on the tabs in the JConsole GUI:
-
Overview tab: A summary of the Java Virtual Machine (JVM) and monitored values.
-
Memory tab: Memory use details, including heap and non-heap memory usage, and an option to start the Java garbage collection process.
-
Threads tab: Thread use details.
-
Classes tab: Class loading details.
-
VM Summary tab: JVM details.
-
MBeans tab: Details about MBeans registered with the JVM.
-
-
On the MBeans tab, in the navigation tree, expand the following directories to browse DSE MBeans:
-
org.apache.cassandra.auth: Permissions cache.
-
org.apache.cassandra.db: Caching, table metrics, and compaction.
-
org.apache.cassandra.internal: Internal server operations, such as gossip, hinted handoff, and Memtable values.
-
org.apache.cassandra.metrics: All DSE metrics, including CQL, clients, keyspaces, read repair, storage, threadpools, and other topics.
-
org.apache.cassandra.net: Internode communication including FailureDetector, MessagingService, and StreamingManager.
-
org.apache.cassandra.request: Tasks related to read, write, and replication operations.
-
org.apache.cassandra.service: GCInspector.
When you select an MBean in the tree, MBean details appear in the MBeanInfo and MBean Descriptor sections, and the tree expands to list any attributes, operations, or notifications associated with the selected MBean.
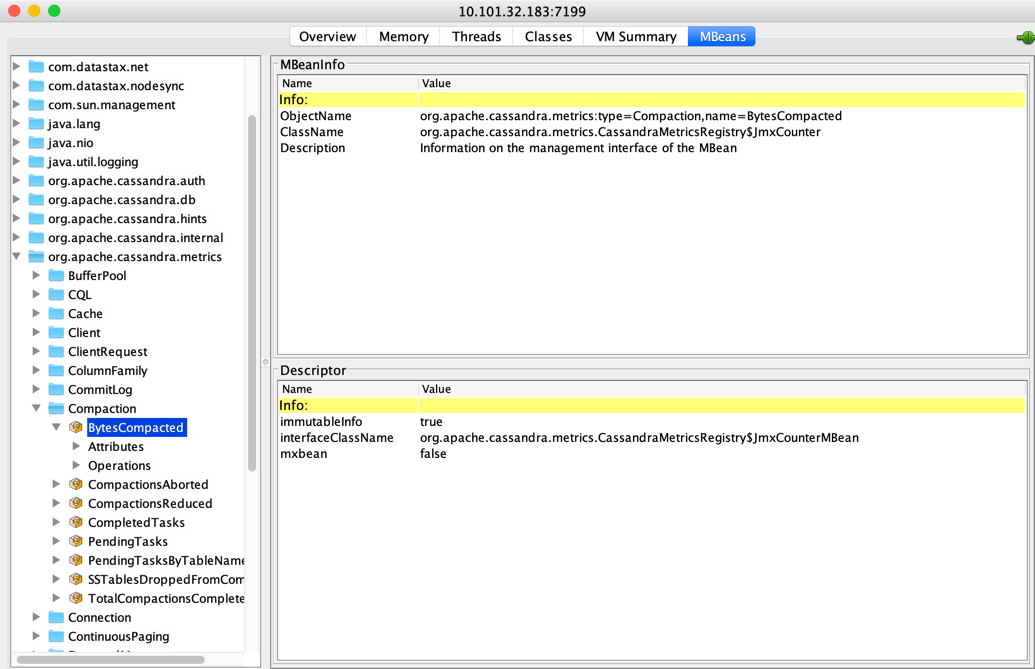 Inspecting org.apache.cassandra.metrics/Compaction in JConsole
 -
Use nodetool
The nodetool utility is a command-line interface for monitoring a cluster and performing routine database operations.
It is typically run from an operational node.
You can use nodetool commands to view detailed table metrics, server metrics, and compaction statistics:
The following example shows the output from nodetool proxyhistograms after running 4,500 insert statements and 45,000 select statements on a three ccm node-cluster on a local machine:
nodetool proxyhistogramsproxy histograms
Percentile Read Latency Write Latency Range Latency
(micros) (micros) (micros)
50% 1502.50 375.00 446.00
75% 1714.75 420.00 498.00
95% 31210.25 507.00 800.20
98% 36365.00 577.36 948.40
99% 36365.00 740.60 1024.39
Min 616.00 230.00 311.00
Max 36365.00 55726.00 59247.00For a summary of the ring and its current state of general health, use nodetool status.
For example:
nodetool statusNote: Ownership information does not include topology; for complete information, specify a keyspace
Datacenter: datacenter1
=======================
Status=Up/Down
|/ State=Normal/Leaving/Joining/Moving
-- Address Load Tokens Owns Host ID Rack
UN 127.0.0.1 47.66 KB 1 33.3% aaa1b7c1-6049-4a08-ad3e-3697a0e30e10 rack1
UN 127.0.0.2 47.67 KB 1 33.3% 1848c369-4306-4874-afdf-5c1e95b8732e rack1
UN 127.0.0.3 47.67 KB 1 33.3% 49578bf1-728f-438d-b1c1-d8dd644b6f7f rack1Use Swiss Java Knife (SJK) with nodetool sjk
SJK is an open-source JVM tool.
In DSE, the nodetool sjk command is a wrapper for SJK.
This command is convenient because you do not need to specify the DSE PID or other parameters that are required when running SJK directly.
For demonstration purposes, the following examples use the mx subcommand to get and set JMX MBean values and interact with a specific list of MBeans.
|
The Instead, use |
-
Get MBean names because SJK is case-sensitive, and exact MBean names are required in
nodetool sjkcommands. -
Get options and values for a specified MBean:
nodetool sjk mx -b "EXACT_MBEAN_NAME" -miFor example, to get the options and values for the
TotalCommitLogSizeMBean:nodetool sjk mx -b "org.apache.cassandra.metrics:name=TotalCommitLogSize,type=CommitLog" -miThis MBean is simple; it has only one
Valueattribute:org.apache.cassandra.metrics:type=CommitLog,name=TotalCommitLogSize org.apache.cassandra.metrics.CassandraMetricsRegistry$JmxGauge - Information on the management interface of the MBean (A) Value : java.lang.Object - Attribute exposed for management (O) objectName() : javax.management.ObjectName - Operation exposed for managementThe output is longer for more complex MBeans, such as latency:
nodetool sjk mx -b "org.apache.cassandra.metrics:name=Latency,scope=Read,type=ClientRequest" -miEach
(A)is a separateValueattribute:org.apache.cassandra.metrics:type=ClientRequest,scope=Read,name=Latency org.apache.cassandra.metrics.CassandraMetricsRegistry$JmxTimer - Information on the management interface of the MBean (A) Max : double - Attribute exposed for management (A) Min : double - Attribute exposed for management (A) Mean : double - Attribute exposed for management (A) StdDev : double - Attribute exposed for management (A) 95thPercentile : double - Attribute exposed for management (A) DurationUnit : String - Attribute exposed for management (A) 50thPercentile : double - Attribute exposed for management (A) 75thPercentile : double - Attribute exposed for management (A) 98thPercentile : double - Attribute exposed for management (A) 99thPercentile : double - Attribute exposed for management (A) 999thPercentile : double - Attribute exposed for management (A) OneMinuteRate : double - Attribute exposed for management (A) FifteenMinuteRate : double - Attribute exposed for management (A) FiveMinuteRate : double - Attribute exposed for management (A) MeanRate : double - Attribute exposed for management (A) RateUnit : String - Attribute exposed for management (A) Count : long - Attribute exposed for management (O) values() : long[] - Operation exposed for management (O) objectName() : javax.management.ObjectName - Operation exposed for management -
Use other
mxoptions to extract specific MBean details.For example, use
-fto read the value of an MBean.For MBeans with simple values, you can get
Valuedirectly, without naming a specificValueattribute:nodetool sjk mx -b "org.apache.cassandra.metrics:name=TotalCommitLogSize,type=CommitLog" -f Value -mgorg.apache.cassandra.metrics:type=CommitLog,name=TotalCommitLogSize 67108864For MBeans with complex values, such as latency, specify a
Valueattribute returned bynodetool sjk mx -b EXACT_MBEAN_NAME -mi:nodetool sjk mx -b "org.apache.cassandra.metrics:name=Latency,scope=Read,type=ClientRequest" -f 99thPercentile -mgorg.apache.cassandra.metrics:type=ClientRequest,scope=Read,name=Latency 3379.391
Similar to jmxterm, SJK also supports setting attribute values (if settable) and calling MBean functions.
Additionally, the scope of the SJK library is not limited to JMX. You can use it to get the thread dump, information about threads, and other functionality.
System metrics
To get metrics about the system environment, such as CPU and disk usage, you can use Linux commands like iostat and dstat.
Advanced monitoring and visualization
For more robust oversight and visualization, you can integrate DSE statistics into dashboards and alerting tools, including DataStax tools and third-party monitoring services.
You can use any of the following tools to monitor DSE clusters and view metrics dashboards:
-
DSE Metrics Collector: Collects metrics from DSE and other entities, such as CPU and disks, using
collectd. Supports export to external observability tools and integrations throughcollectdplugins. For example, you can expose data to Prometheus with visualization via Grafana using predefined dashboards from DataStax. -
DSE OpsCenter Performance Service with DSE Metrics Collector
-
JMX integrations and tools: For example, JMX Exporter for Prometheus.
