DSE Advanced Replication metrics
Collect metrics on each source node to review the current status of that node in the source cluster. A working source and destination configuration is required to use the metrics feature. See Get started with DSE Advanced Replication.
Ensure JMX access
Metrics are stored in the DataStax Enterprise (DSE) JMX system. JMX access is required.
-
For production, DataStax recommends authenticating JMX users, see Configure JMX Authentication.
-
Use these steps to enable local JMX access. Localhost access is useful for test and development.
-
On the source node, edit
cassandra-env.shand enable local JMX:JVM_OPTS="$JVM_OPTS -Djava.rmi.server.hostname=localhost" LOCAL_JMX=yes -
On the source node, restart DSE to recognize the local JMX change.
-
Get metrics
You can get advanced replication metrics on the command line or through JMX.
- Use the command line
-
Use the
dse advrepcommand line tool to display metrics on the command line. Ensure that the source node meets the command line prerequisites.On the source node, run the following command:
dse advrep --jmx-port 7199 metrics listThe output lists the metrics retrieved from the source node:
------------------------------------------ |Group |Type |Count| ------------------------------------------ |Tables |MessagesDelivered |1002 | ------------------------------------------ |ReplicationLog|CommitLogsToConsume|1 | ------------------------------------------ |Tables |MessagesReceived |1002 | ------------------------------------------ |ReplicationLog|MessageAddErrors |0 | ------------------------------------------ |ReplicationLog|CommitLogsDeleted |0 | ------------------------------------------ ------------------------------------------------------------------------------------------------------------------------------------------------- |Group |Type |Count|RateUnit |MeanRate |FifteenMinuteRate |OneMinuteRate |FiveMinuteRate | ------------------------------------------------------------------------------------------------------------------------------------------------- |ReplicationLog|MessagesAdded |1002 |events/second|0.012688461014514603|9.862886141388435E-39|2.964393875E-314 |2.322135514219019E-114 | ------------------------------------------------------------------------------------------------------------------------------------------------- |ReplicationLog|MessagesDeleted |0 |events/second|0.0 |0.0 |0.0 |0.0 | ------------------------------------------------------------------------------------------------------------------------------------------------- |ReplicationLog|MessagesAcknowledged |1002 |events/second|0.012688456391385135|9.86403600116801E-39 |2.964393875E-314 |2.3230339468969963E-114| ------------------------------------------------------------------------------------------------------------------------------------------------- |ReplicationLog|CommitLogMessagesRead|16873|events/second|0.21366497971804438 |0.20580430240786005 |0.39126032533612265|0.2277227124698431 | ------------------------------------------------------------------------------------------------------------------------------------------------- ------------------------------------- |Group |Type |Value| ------------------------------------- |Transmission|AvailablePermits|30000| ------------------------------------- - Use JMX
-
Any JMX tool, such as
jconsole, can access the MBeans for advanced replication.-
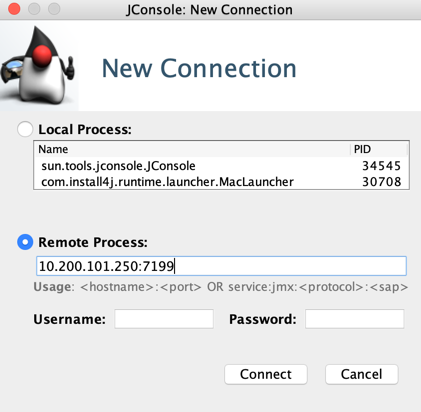
Establish a remote connection using port 7199 and the source node’s hostname or IP address.
-
Go to the
MBeanstab, and then find thecom.datastax.bdp.advrep.v2.metricsdirectory.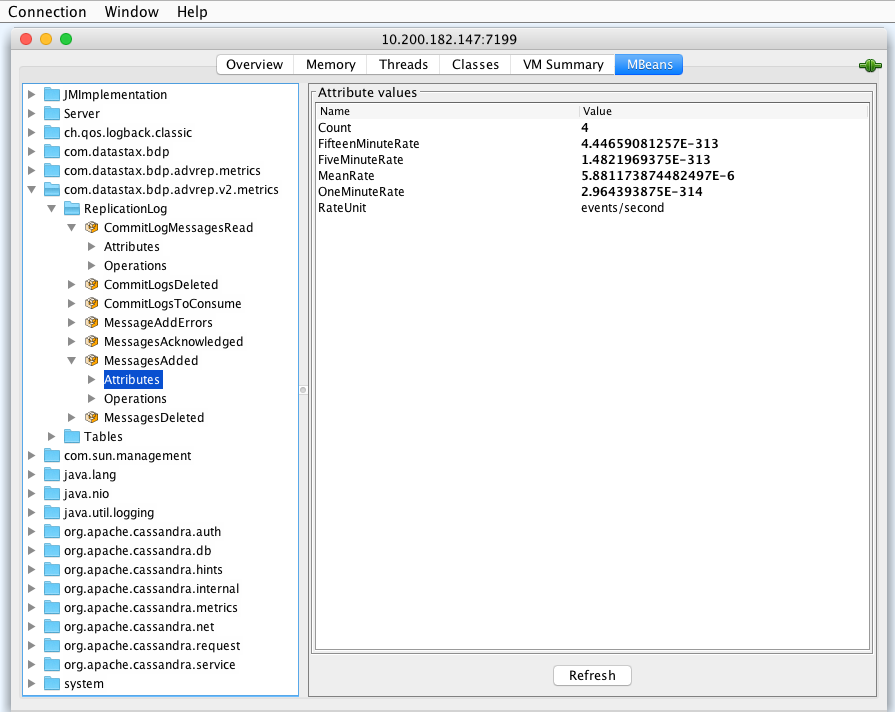
Metrics are exposed as JMX MBeans under the
com.datastax.bdp.advrep.v2.metricspath. They are logically divided into subdirectories that correspond to architecture components:-
ReplicationLoggroup -
Transmissiongroup -
AdvancedReplicationHub-DESTINATION_NAME-metricsgroup
The
Tablesubdirectory contains performance metrics by table.If you are upgrading from an earlier version, metrics for DSE 5.x (advanced replication V1) are still present in the MBeans.
-
-
Metrics types
Metrics can be any of the following types:
- Counter
-
A simple incrementing and decrementing 64-bit integer.
- Meter
-
Measures the rate at which a set of events occur.
- Histogram
-
Measures the distribution of values in a stream of data.
- Timer
-
A histogram of the duration of a type of event and a meter of the rate of its occurrence.
- Gauge
-
A gauge is an instantaneous measurement of a value.
ReplicationLog group metrics
| Metric name | Description | Metric type |
|---|---|---|
|
The number of messages that were added to the replication log, and the rate that the messages were added, per replica. |
Meter |
|
The number of messages that were acknowledged (and removed) from the replication log. Acknowledgement can be 1 or 1+n if errors occur. |
Meter |
|
The number of messages that were deleted from the replication log, including invalid messages and messages that were removed after a channel truncate operation. |
Meter |
|
The number of errors that occurred when adding a message to the replication log. |
Counter |
|
The number of commit logs that need to be consumed that have advanced replication messages. |
Counter |
|
The number of commit log messages added to the replication log. The commit log messages are read if a message pertains to a source table that has collection enabled. |
Meter |
|
The number of commit log messages deleted from the commit log after adding to the replication log.
Like |
Meter |
Transmission group metrics
| Metric name | Description | Metric type |
|---|---|---|
|
The current number of available global permits for transmission. |
Gauge |
AdvancedReplicationHub destination group metrics
Metrics for the AdvancedReplicationHub-DESTINATION_NAME-metrics group are provided automatically by the DSE-embedded Java driver.
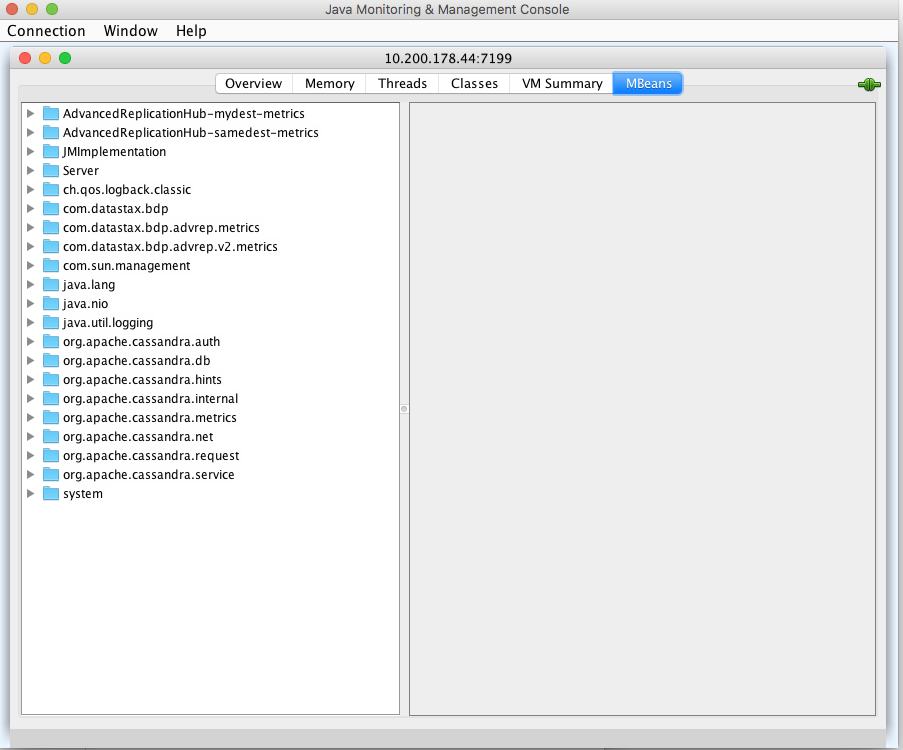
Some examples of destination-specific metrics include the following:
| Metric name | Metric type |
|---|---|
known-hosts |
Counter |
connected-to |
Counter |
open-connections |
Counter |
requests-timer |
Timer |
connection-errors |
Counter |
write-timeouts |
Counter |
read-timeouts |
Counter |
unavailables |
Counter |
other-errors |
Counter |
retries |
Counter |
ignores |
Counter |
Performance metrics per table
You can use JMX to find performance metrics per table.
Under MBeans, navigate to the Tables directory for com.datastax.bdp.advrep.v2.metrics, and then select a table to inspect its metrics.
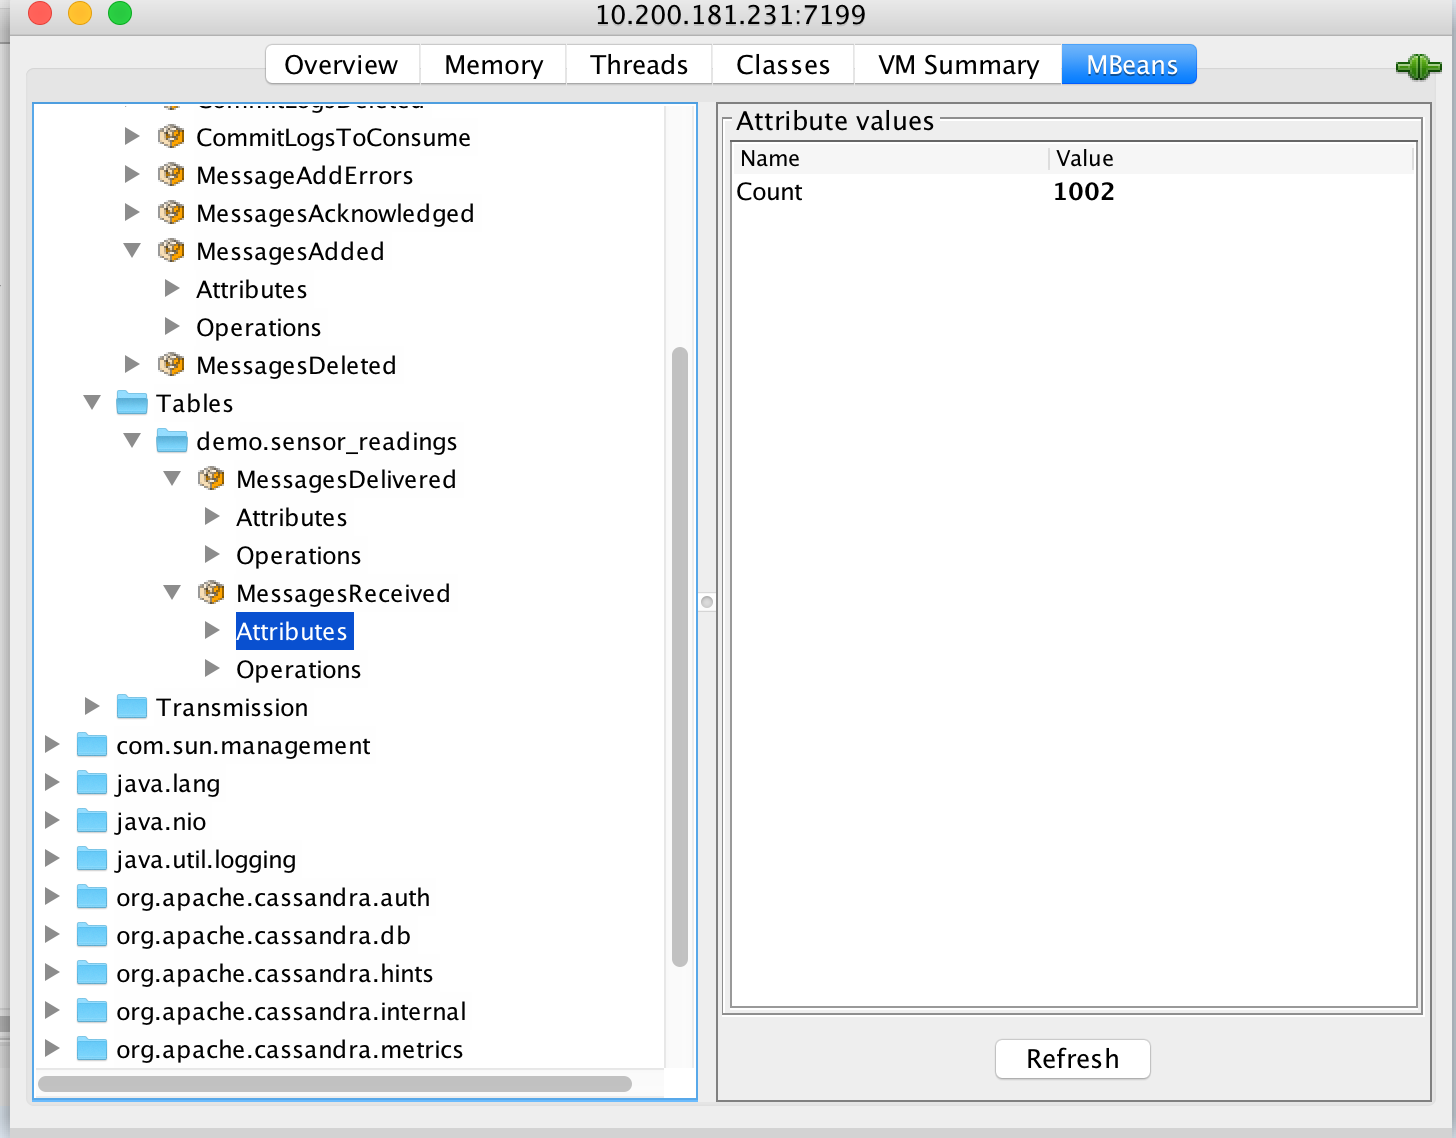
For example, to access the MessagesReceived metric for the table sensor_readings in the keyspace demo look at the following path:
com.datastax.bdp.advrep.v2.metrics:type=Tables,scope=demo.sensor_readings,name=MessagesReceivedThe following metrics are provided for each table:
| Metric name | Description | Metric type |
|---|---|---|
|
The number of messages received from the source cluster for this table. |
Counter |
|
The number of messages for the source table that were replicated to the destination. |
Counter |
|
The number of messages that were deleted from the replication log, including invalid messages and messages that were removed after a channel truncate operation. |
Counter |
