DSE cluster metrics
DataStax Enterprise (DSE) exposes a number of statistics and management operations through Java Management Extensions (JMX), including all metrics from Apache Cassandra® monitoring.
Table statistics
For individual tables, the ColumnFamilyStoreMBean provides the same general latency attributes as StorageProxyMBean.
Unlike StorageProxyMBean, ColumnFamilyStoreMBean has a number of other statistics that are important to monitor for performance trends.
For example:
- MemtableDataSize
-
The total size consumed by this table’s data (not including metadata).
- MemtableColumnsCount
-
Returns the total number of columns present in the memtable (across all keys).
- MemtableSwitchCount
-
How many times the memtable has been flushed out.
- RecentReadLatencyMicros
-
The average read latency since the last call to this bean.
The recent read latency and write latency counters are important for making sure operations happen in a consistent manner. If these counters start to increase after a period of stability, you might need to scale up the cluster’s capacity.
- RecentWriterLatencyMicros
-
The average write latency since the last call to this bean.
The recent read latency and write latency counters are important for making sure operations happen in a consistent manner. If these counters start to increase after a period of stability, you might need to scale up the cluster’s capacity.
- LiveSSTableCount
-
The number of live SSTables for this table.
DataStax recommends that you set a threshold to monitor
LiveSSTableCountand ensure that the number of SSTables for a given table doesn’t become too great.
For more information about memtables and SSTables, see Writes and Data maintenance through compaction.
Thread pool statistics
The DataStax Enterprise (DSE) database maintains distinct thread pools for different stages of execution. Each thread pool provides statistics on the number of tasks that are active, pending, delayed, completed, and blocked.
The database tracks latency (averages and totals) of read, write, and slicing operations at the server level through StorageProxyMBean.
For tread pool statistics report details, see the command reference for nodetool tpstats .
You can also inspect thread pool statistics in the DSE OpsCenter Node Details dialog, and you can use OpsCenter Monitoring to configure alerts and dashboard graphs for thread pool metrics.
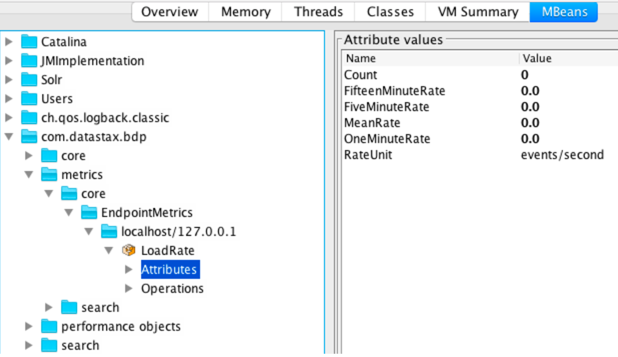
EndpointMetrics MBean
The EndpointMetrics MBean tracks the number of requests per second made to each endpoint by the DSE internode communication router.
NodeSyncMetrics MBeans
The NodeSyncMetrics MBeans track data validation operations on a node.
NodeSyncMetrics MBeans are available at the following paths:
-
Global metric path:
com.datastax.nodesync:type=NodeSyncMetrics,name=METRIC_NAME -
Per table metric path:
org.apache.cassandra.metrics:type=Table,keyspace=KEYSPACE_NAME,scope=TABLE_NAME,name=METRIC_NAME
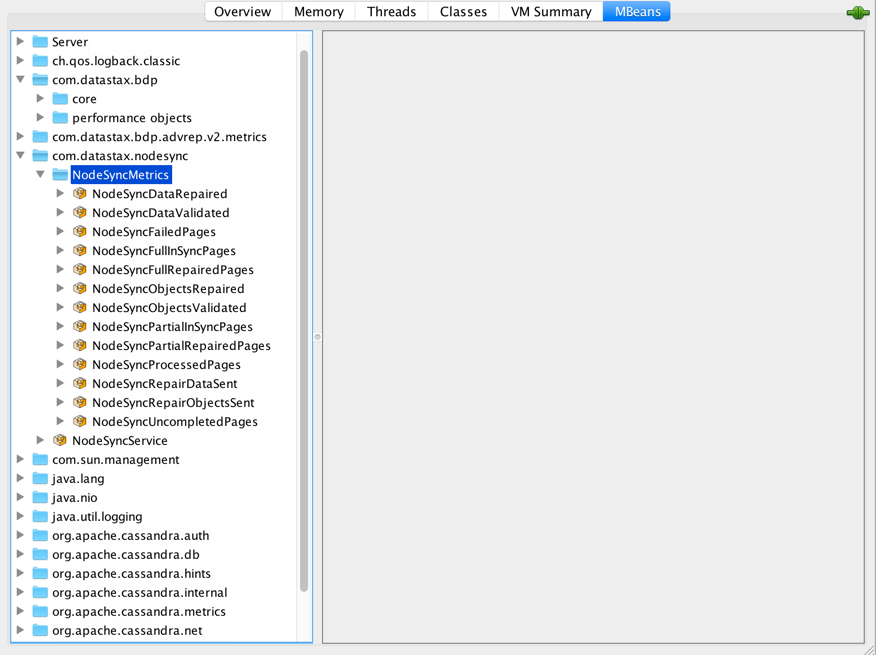
NodeSyncMetrics MBeans in JConsoleNodeSyncObject and NodeSyncData metrics
NodeSync repairs data and objects. Objects can be rows, range tombstones, or deletion information.
- NodeSyncObjectsRepaired
-
Inconsistent objects (rows + range tombstones) that NodeSync validated and repaired. The number of rows and range tombstones is equivalent to
NodeSyncDataRepaired. - NodeSyncObjectsValidated
-
Number of objects (rows + range tombstones) that NodeSync validated by checking for inconsistencies. The number of rows and range tombstones is equivalent to
NodeSyncDataValidated. - NodeSyncRepairObjectsSent
-
Number of objects sent required to repair replicas. This attribute differs from
NodeSyncDataRepairedin that 100 bytes of data that was inconsistent and repaired can be sent to multiple replicas, providing a more accurate representation of repair traffic generated between nodes. - NodeSyncDataValidated
-
Amount of data (in bytes) that NodeSync validated by checking for inconsistencies.
- NodeSyncDataRepaired
-
Inconsistent data that NodeSync validated and repaired.
- NodeSyncRepairDataSent
-
Size of data (in bytes) sent for repairing inconsistencies found by NodeSync. This metric differs from
NodeSyncDataRepairedin that if a row of a specific size is inconsistent, that number is counted inNodeSyncDataRepaired. However, more or less of the same number can be counted inNodeSyncRepairDataSent, because the row can be inconsistent on more than one node, but only a portion of the row might be inconsistent (and thus sent).
NodeSyncPage metrics
NodeSync validates data by pages, which are the least granular objects that NodeSync operates on. NodeSync collects pages by outcomes, and the resulting numbers are meaningful in comparison. For example, the percentage of pages already fully in sync that did not require repair.
- NodeSyncFailedPages
-
Number of pages not validated due to an unexpected error.
- NodeSyncFullInSyncPages
-
Number of pages fully validated (all replicas responded) that had no inconsistencies.
- NodeSyncFullRepairedPages
-
Number of pages fully validated (all replicas responded) that had inconsistencies, and which were successfully repaired.
- NodeSyncPartialInSyncPages
-
Number of pages partially validated (some replicas responded) that had no inconsistencies.
- NodeSyncPartialRepairedPages
-
Number of pages partially validated (some replicas responded) that had inconsistencies, and which were successfully repaired.
- NodeSyncProcessedPages
-
Total number of processed pages since the last node restart, calculated as the sum of all other page counters.
- NodeSyncUncompletedPages
-
Subset of
NodeSyncProcessedPagesthat failed to process. The reason could be that only one node was up and the page was skipped, some replicas failed during processing, or some unexpected error occurred.
NodeSyncMetrics attributes
Each of the NodeSyncMetrics MBeans can return one or more of the following attributes:
- MeanRate
-
Mean of the
OneMinuteRate,FiveMinuteRate, andFifteenMinuteRateattributes. - OneMinuteRate
-
Number of objects processed for the given MBean in a one minute period.
- FiveMinuteRate
-
Number of objects processed for the given MBean in a five minute period.
- FifteenMinuteRate
-
Number of objects processed for the given MBean in a fifteen minute period.
- RateUnit
-
Unit of measurement for rate processing, which is number of events per second.
- Count
-
Total number of objects processed for the given MBean.
For MBeans that store multiple values, use -f to select a value.
For example, to return the global mean rate of a node:
nodetool sjk mx -b "com.datastax.nodesync:type=NodeSyncMetrics,name=NodeSyncObjectsValidated" -f MeanRate -mgThe output shows the object name and value:
com.datastax.nodesync:type=NodeSyncMetrics,name=NodeSyncObjectsValidated
2.542410005904823
NodeSync Service MBean
The NodeSync Service MBean provides details about the local service and allows remote operations.
The NodeSync Service MBean is available at the following path:
com.datastax.nodesync:type=NodeSyncServiceThe NodeSync Service MBean has the following attributes:
- TracingEnabled
-
Whether tracing is enabled on the node.
- Running
-
Whether the service is running.
- Rate
-
Provides the effective validation rate.
For example, to get the effective rate:
nodetool sjk mx -b "com.datastax.nodesync:type=NodeSyncService" -f Rate -mgThe output shows the object name and value:
com.datastax.nodesync:type=NodeSyncService
1024